2019 UK local government election
Elections to elect all members of the North West Leicestershire District Council took place on 2 May 2019, held as one of the English local elections of that year.[1]
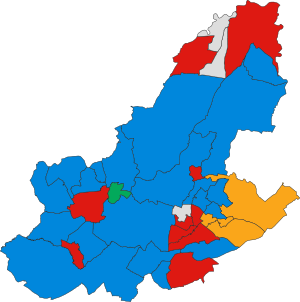
Summary
Election result
| 2019 North West Leicestershire District Council election |
| Party | Candidates | Seats | Gains | Losses | Net gain/loss | Seats % | Votes % | Votes | +/− |
| | Conservative | 38 | 20 | 2 | 7 |  5 5 | 52.6 | 45.1 | 11,072 | –1.8 |
| | Labour | 38 | 10 | 3 | 3 |  | 26.3 | 33.0 | 8,116 | –1.2 |
| | Liberal Democrats | 16 | 4 | 3 | 0 |  3 3 | 10.5 | 12.3 | 3,032 | +5.9 |
| | Independent | 4 | 3 | 1 | 0 | 1 | 7.9 | 3.9 | 948 | –0.2 |
| | Green | 1 | 1 | 1 | 0 | 1 | 2.6 | 1.7 | 429 | +1.4 |
| | UKIP | 6 | 0 | 0 | 0 | | 0.0 | 3.3 | 805 | –4.5 |
| | Libertarian | 1 | 0 | 0 | 0 | | 0.0 | 0.3 | 83 | N/A |
| | Monster Raving Loony | 1 | 0 | 0 | 0 | | 0.0 | 0.3 | 76 | N/A |
Ward results
Appleby
Appleby | Party | Candidate | Votes | % | ±% |
| | Conservative | Richard Blunt | 451 | 58.5 | |
| | Labour | Joe Wain | 127 | 16.5 | |
| | Liberal Democrats | David Wyatt | 117 | 15.2 | |
| | Monster Raving Loony | Colin Roberts | 76 | 9.9 | |
| Majority | | | |
| Turnout | 778 | | |
| | Conservative hold | Swing | | |
Ashby Castle
Ashby Castle | Party | Candidate | Votes | % | ±% |
| | Green | Carl Benfield | 429 | 43.0 | |
| | Conservative | John Coxon | 427 | 42.8 | |
| | Labour | Paul Montgomery | 141 | 14.1 | |
| Majority | | | |
| Turnout | 1,008 | | |
| | Green gain from Conservative | Swing | | |
Ashby Holywell
Ashby Holywell | Party | Candidate | Votes | % | ±% |
| | Conservative | Roger Bayliss | 379 | 52.5 | |
| | Labour | Doug Cooper | 235 | 32.5 | |
| | Liberal Democrats | Maxine Sedgwick | 108 | 15.0 | |
| Majority | | | |
| Turnout | 749 | | |
| | Conservative hold | Swing | | |
Ashby Ivanhoe
Ashby Ivanhoe | Party | Candidate | Votes | % | ±% |
| | Conservative | Jim Hoult | 450 | 54.9 | |
| | Labour | Elaine Robinson | 370 | 45.1 | |
| Majority | | | |
| Turnout | 845 | | |
| | Conservative hold | Swing | | |
Ashby Money Hill
Ashby Money Hill | Party | Candidate | Votes | % | ±% |
| | Conservative | Daniel Harrison | 375 | 60.5 | |
| | Labour | Avril Wilson | 245 | 39.5 | |
| Majority | | | |
| Turnout | 646 | | |
| | Conservative hold | Swing | | |
Ashby Willesley
Ashby Willesley | Party | Candidate | Votes | % | ±% |
| | Labour | Dave Bigby | 424 | 53.5 | |
| | Conservative | David Jones | 368 | 46.5 | |
| Majority | | | |
| Turnout | 830 | | |
| | Labour gain from Conservative | Swing | | |
Ashby Woulds
Ashby Woulds | Party | Candidate | Votes | % | ±% |
| | Conservative | John Bridges | 339 | 61.4 | |
| | Labour | Anne Donegan | 213 | 38.6 | |
| Majority | | | |
| Turnout | 582 | | |
| | Conservative hold | Swing | | |
Bardon
Bardon | Party | Candidate | Votes | % | ±% |
| | Liberal Democrats | Angela Black | 295 | 48.1 | |
| | Conservative | Mick Specht | 122 | 19.9 | |
| | Labour | Nick Clarke | 113 | 18.4 | |
| | Libertarian | Dan Liddicott | 83 | 13.5 | |
| Majority | | | |
| Turnout | 626 | | |
| | Liberal Democrats gain from Conservative | Swing | | |
Blackfordby
Blackfordby | Party | Candidate | Votes | % | ±% |
| | Conservative | Hill Hoult | 361 | 53.4 | |
| | Labour | Kath Lauro | 315 | 46.6 | |
| Majority | | | |
| Turnout | 705 | | |
| | Conservative gain from Labour | Swing | | |
Broom Leys
Broom Leys | Party | Candidate | Votes | % | ±% |
| | Conservative | Alexander Bridgen | 366 | 39.7 | |
| | Liberal Democrats | Lee Windram | 344 | 37.3 | |
| | Labour | Anthony Barker | 212 | 23.0 | |
| Majority | | | |
| Turnout | 945 | | |
| | Conservative gain from Labour | Swing | | |
Castle Donington Castle
Castle Donington Central
Castle Donington Central | Party | Candidate | Votes | % | ±% |
| | Independent | Rachel Canny | 435 | 68.1 | |
| | Conservative | Lisa Collins | 146 | 22.8 | |
| | Labour | Dan Green | 58 | 9.1 | |
| Majority | | | |
| Turnout | 652 | | |
| | Independent hold | Swing | | |
Castle Donington Park
Castle Donington Park | Party | Candidate | Votes | % | ±% |
| | Labour | Michael Hay | 190 | 54.4 | |
| | Conservative | Leigh Brothwell | 159 | 45.6 | |
| Majority | | | |
| Turnout | 374 | | |
| | Labour gain from Conservative | Swing | | |
Castle Rock
Castle Rock | Party | Candidate | Votes | % | ±% |
| | Liberal Democrats | Michael Wyatt | 432 | 61.7 | |
| | Conservative | Paula Purver | 164 | 23.4 | |
| | Labour | Olivia Andrade | 104 | 14.9 | |
| Majority | | | |
| Turnout | 716 | | |
| | Liberal Democrats hold | Swing | | |
Coalville East
Coalville East | Party | Candidate | Votes | % | ±% |
| | Liberal Democrats | Marie French | 286 | 44.5 | |
| | Conservative | Ronald Cotterill | 200 | 31.1 | |
| | Labour | Elijah Bennett | 157 | 24.4 | |
| Majority | | | |
| Turnout | 647 | | |
| | Liberal Democrats gain from Conservative | Swing | | |
Coalville West
Coalville West | Party | Candidate | Votes | % | ±% |
| | Labour Co-op | John Legrys | 209 | 45.0 | |
| | Liberal Democrats | Moira Lynch | 151 | 32.5 | |
| | Conservative | Mary Tuckey | 104 | 22.4 | |
| Majority | | | |
| Turnout | 472 | | |
| | Labour hold | Swing | | |
Daleacre
Daleacre | Party | Candidate | Votes | % | ±% |
| | Labour | Carol Sewell | 305 | 53.4 | |
| | Conservative | Clare Watson-Spence | 266 | 46.6 | |
| Majority | | | |
| Turnout | 590 | | |
| | Labour gain from Conservative | Swing | | |
Ellistown and Battleflat
Ellistown and Battleflat | Party | Candidate | Votes | % | ±% |
| | Conservative | Keith Merrie | 272 | 47.9 | |
| | UKIP | Matthew Pollard | 123 | 21.7 | |
| | Labour | Martin Walton | 109 | 19.2 | |
| | Liberal Democrats | Sheila Wyatt | 64 | 11.3 | |
| Majority | | | |
| Turnout | 576 | | |
| | Conservative hold | Swing | | |
Greenhill
Greenhill | Party | Candidate | Votes | % | ±% |
| | Liberal Democrats | Jake Windram | 232 | 38.9 | |
| | Labour | Ron Adams | 183 | 30.7 | |
| | UKIP | Benny Wileman | 124 | 20.8 | |
| | Conservative | Robert Bradley | 57 | 9.6 | |
| Majority | | | |
| Turnout | 605 | | |
| | Liberal Democrats gain from Labour | Swing | | |
Hermitage
Hermitage | Party | Candidate | Votes | % | ±% |
| | Conservative | Stuart Gillard | 277 | 53.3 | |
| | Labour | Peter Moult | 243 | 46.7 | |
| Majority | | | |
| Turnout | 541 | | |
| | Conservative hold | Swing | | |
Holly Hayes
Holly Hayes | Party | Candidate | Votes | % | ±% |
| | Conservative | Tony Gillard | 421 | 61.6 | |
| | Labour | Alison Andrade | 262 | 38.4 | |
| Majority | | | |
| Turnout | 709 | | |
| | Conservative hold | Swing | | |
Hugglescote St. John's
Hugglescote St. John's | Party | Candidate | Votes | % | ±% |
| | Labour | Russell Johnson | 236 | 49.0 | |
| | Conservative | Vicki Boam | 168 | 34.9 | |
| | Liberal Democrats | Aaron Windram | 78 | 16.2 | |
| Majority | | | |
| Turnout | 502 | | |
| | Labour hold | Swing | | |
Hugglescote St. Mary's
Hugglescote St. Mary's | Party | Candidate | Votes | % | ±% |
| | Labour Co-op | Terri Eynon | 243 | 37.9 | |
| | Conservative | Will Jennings | 222 | 34.6 | |
| | Liberal Democrats | James Hemsley | 176 | 27.5 | |
| Majority | | | |
| Turnout | 657 | | |
| | Labour Co-op hold | Swing | | |
Ibstock East
Ibstock East | Party | Candidate | Votes | % | ±% |
| | Labour | Daniel Tebbutt | 222 | 41.8 | |
| | Conservative | Pamela Spence | 171 | 32.2 | |
| | UKIP | George Norley | 138 | 26.0 | |
| Majority | | | |
| Turnout | 539 | | |
| | Labour hold | Swing | | |
Ibstock West
Ibstock West | Party | Candidate | Votes | % | ±% |
| | Conservative | John Clarke | 361 | 65.0 | |
| | Labour | Jim Roberts | 194 | 35.0 | |
| Majority | | | |
| Turnout | 579 | | |
| | Conservative hold | Swing | | |
Kegworth
Kegworth | Party | Candidate | Votes | % | ±% |
| | Conservative | Bertie Rushton | 340 | 64.9 | |
| | Labour | David Manley | 184 | 35.1 | |
| Majority | | | |
| Turnout | 562 | | |
| | Conservative hold | Swing | | |
Long Whatton and Diseworth
Long Whatton and Diseworth | Party | Candidate | Votes | % | ±% |
| | Conservative | Nicholas Rushton | 482 | 57.3 | |
| | Labour | Anna Champneys | 359 | 42.7 | |
| Majority | | | |
| Turnout | 865 | | |
| | Conservative hold | Swing | | |
Measham North
Measham North | Party | Candidate | Votes | % | ±% |
| | Conservative | Andrew Woodman | 242 | 45.1 | |
| | Labour Co-op | Laurie Andrade | 190 | 35.4 | |
| | UKIP | Angela Ross | 105 | 19.6 | |
| Majority | | | |
| Turnout | 540 | | |
| | Conservative hold | Swing | | |
Measham South
Measham South | Party | Candidate | Votes | % | ±% |
| | Labour Co-op | Sean Sheahan | 281 | 45.0 | |
| | UKIP | Karen Lott | 193 | 30.9 | |
| | Conservative | Annette Bridges | 150 | 24.0 | |
| Majority | | | |
| Turnout | 630 | | |
| | Labour Co-op hold | Swing | | |
Oakthorpe and Donisthorpe
Oakthorpe and Donisthorpe | Party | Candidate | Votes | % | ±% |
| | Conservative | Robert Ashman | 338 | 61.7 | |
| | Labour | Richard Dyason | 210 | 38.3 | |
| Majority | | | |
| Turnout | 574 | | |
| | Conservative hold | Swing | | |
Ravenstone and Packington
Ravenstone and Packington | Party | Candidate | Votes | % | ±% |
| | Conservative | Nigel Smith | 510 | 59.1 | |
| | Liberal Democrats | David Holliday | 216 | 25.0 | |
| | Labour | Kathleen Timberley | 137 | 15.9 | |
| Majority | | | |
| Turnout | 885 | | |
| | Conservative hold | Swing | | |
Sence Valley
Sence Valley | Party | Candidate | Votes | % | ±% |
| | Conservative | Virge Richichi | 369 | 60.6 | |
| | Labour | Rupert Knapton | 240 | 39.4 | |
| Majority | | | |
| Turnout | 630 | | |
| | Conservative hold | Swing | | |
Snibston North
Snibston North | Party | Candidate | Votes | % | ±% |
| | Independent | Elliott Allman | 134 | 26.2 | |
| | Labour | Fliss Middleton | 133 | 26.0 | |
| | Conservative | Hope Brothwell | 130 | 25.4 | |
| | Liberal Democrats | Vivienne Brooks | 114 | 22.3 | |
| Majority | | | |
| Turnout | 515 | | |
| | Independent gain from Conservative | Swing | | |
Snibston South
Snibston South | Party | Candidate | Votes | % | ±% |
| | Labour | John Geary | 177 | 33.7 | |
| | Liberal Democrats | Jack Coleman | 134 | 25.5 | |
| | UKIP | Paul Martin | 122 | 23.2 | |
| | Conservative | Paul Spence | 92 | 17.5 | |
| Majority | | | |
| Turnout | 530 | | |
| | Labour hold | Swing | | |
Thornborough
Thornborough | Party | Candidate | Votes | % | ±% |
| | Conservative | Louise Gillard | 362 | 48.9 | |
| | Labour | Ray Woodward | 287 | 38.8 | |
| | Independent | John Smith | 91 | 12.3 | |
| Majority | | | |
| Turnout | 761 | | |
| | Conservative hold | Swing | | |
Thringstone
Thringstone | Party | Candidate | Votes | % | ±% |
| | Labour | Dave Everitt | 307 | 56.5 | |
| | Conservative | Mark Evans | 236 | 43.5 | |
| Majority | | | |
| Turnout | 574 | | |
| | Labour hold | Swing | | |
Valley
Valley | Party | Candidate | Votes | % | ±% |
| | Conservative | Russell Boam | 490 | 60.8 | |
| | Labour | Paul Cudby | 161 | 20.0 | |
| | Liberal Democrats | Paul Tyler | 155 | 19.2 | |
| Majority | | | |
| Turnout | 830 | | |
| | Conservative hold | Swing | | |
Worthington and Breedon
Worthington and Breedon | Party | Candidate | Votes | % | ±% |
| | Conservative | David Stevenson | 550 | 66.5 | |
| | Labour | Gregory Parle | 147 | 17.8 | |
| | Liberal Democrats | Alan Turner | 130 | 15.7 | |
| Majority | | | |
| Turnout | 846 | | |
| | Conservative hold | Swing | | |
Changes 2019–2023
Elliott Allman, elected as an independent in Snibston North ward, joined the Conservatives in 2020.[2]
Ibstock East By-Election, 6 May 2021[3] | Party | Candidate | Votes | % | ±% |
| | Conservative | Jenny Simmons | 355 | 57.8 | +25.6 |
| | Labour | Carissma Griffiths | 164 | 26.7 | -15.1 |
| | Liberal Democrats | David Wyatt | 54 | 8.8 | +8.8 |
| | Green | Liz Fletcher | 41 | 6.7 | +6.7 |
| Majority | 191 | 31.1 | |
| Turnout | 614 | | |
| | Conservative gain from Labour | Swing | | |
Worthington and Breedon By-Election, 6 May 2021[4] | Party | Candidate | Votes | % | ±% |
| | Conservative | Raymond Morris | 696 | 69.7 | +3.2 |
| | Labour | Gregory Parle | 139 | 13.9 | -3.9 |
| | Green | Gareth Shilton | 104 | 10.4 | +10.4 |
| | Liberal Democrats | Paul Tyler | 60 | 6.0 | -9.7 |
| Majority | 557 | 55.8 | |
| Turnout | 999 | | |
| | Conservative hold | Swing | | |
Russell Johnson, elected as a Labour councillor in Hugglestone St John's ward, left the party to sit as an independent early in 2023.[5]
References
- ^ "Election results by Wards,2 May 2019". 2 May 2019.
- ^ Hill, Graham (3 September 2020). "District Councillor Allman crosses floor to join Conservative with focus on Coalville's future". Coalville Nub News. Retrieved 1 November 2023.
- ^ "Local Elections Archive Project — Ibstock East Ward". www.andrewteale.me.uk. Retrieved 31 August 2022.
- ^ "Local Elections Archive Project — Worthington and Breedon Ward". www.andrewteale.me.uk. Retrieved 31 August 2022.
- ^ Boothroyd, David (3 March 2023). "Greens afloat in Cinque Port". Local Councils. Thorncliffe. Retrieved 2 November 2023.


 5
5 
 3
3  Council elections in Leicestershire


