2023 UK local government election
2023 Herefordshire Council election
|
| ← 2019 | 4 May 2023 (2023-05-04) | 2027 → |
|
All 53 seats to Herefordshire Council
27 seats needed for a majority |
|---|
| Turnout | 37.3% |
|---|
| | First party | Second party | Third party | | |  | | | | Leader | Jonathan Lester | Terry James | Ellie Chowns | | Party | Conservative | Liberal Democrats | Green | | Last election | 13 seats, 34.2% | 7 seats, 9.9% | 7 seats, 13.1% | | Seats before | 14 | 6 | 7 | | Seats won | 21 | 12 | 9 | | Seat change |  8 8 | 5 | 2 | | Popular vote | 18,940 | 13,257 | 7,299 | | Percentage | 34.6% | 24.2% | 13.3% | | Swing | 0.4% | 14.3% | 0.2% |
| | | Fourth party | Fifth party | Sixth party | | | | | | | Party | Independent | It's Our County | Labour | | Last election | 18 seats, 28.5% | 8 seats, 8.7% | 0 seats, 3.5% | | Seats before | 25[a] | [b] | 1 | | Seats won | 8 | 2 | 1 | | Seat change |  10 10 | 6 | 1 | | Popular vote | 11,834 | 896 | 2,235 | | Percentage | 21.6% | 1.6% | 4.1% | | Swing | 6.9% | 7.1% | 0.6% | |
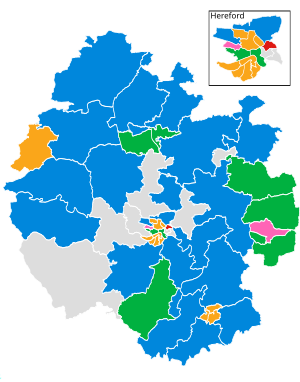 Winner of each seat at the 2023 Herefordshire Council election |
Leader before election
David Hitchiner
Independents for Herefordshire
No overall control | Leader after election
Jonathan Lester
Conservative
No overall control | |
The 2023 Herefordshire Council election took place on 4 May 2023 to elect members of Herefordshire Council in Herefordshire, England.[1] This was on the same day as other local elections in the UK.
Prior to the election the council was under no overall control, being led by David Hitchiner of the Independents for Herefordshire group.[2] After the election the council remained under no overall control, but the Conservatives gained seats and managed to form a minority administration led by Jonathan Lester.[3]
Summary
Election result
| 2023 Herefordshire Council election |
| Party | Candidates | Seats | Gains | Losses | Net gain/loss | Seats % | Votes % | Votes | +/− |
| | Conservative | 53 | 21 | 11 | 3 | 8 | 39.6 | 34.6 | 18,940 | 0.4 |
| | Liberal Democrats | 53 | 12 | 6 | 1 | 5 | 22.6 | 24.2 | 13,257 | 14.3 |
| | Independent | 45 | 8 | 3 | 13 | 10 | 15.1 | 21.6 | 11,834 | 6.9 |
| | Green | 19 | 9 | 3 | 1 | 2 | 17.0 | 13.3 | 7,299 | 0.2 |
| | Labour | 14 | 1 | 1 | 0 | 1 | 1.9 | 4.1 | 2,235 | 0.6 |
| | It's Our County | 3 | 2 | 0 | 6 | 6 | 3.8 | 1.6 | 896 | 7.1 |
| | Reform UK | 6 | 0 | 0 | 0 |  | 0.0 | 0.6 | 317 | New |
Candidates
The Statement of Persons Nominated, which details the candidates standing in each ward, was released by Herefordshire Council following the close of nominations on 4 April 2023.[4] The results were:[5][6]
Arrow
Arrow | Party | Candidate | Votes | % | ±% |
| | Conservative | Roger Phillips* | 950 | 72.8 | 7.0 |
| | Liberal Democrats | Dan Ciolte | 181 | 13.9 | N/A |
| | Green | John Whitelegg | 174 | 13.3 | N/A |
| Majority | 769 | 58.9 | 0.7 |
| Turnout | 1305 | 44.4 | |
| | Conservative hold |
Aylestone Hill
Aylestone Hill | Party | Candidate | Votes | % | ±% |
| | Labour | Adam Spencer | 379 | 37.9 | N/A |
| | Independent | Ange Tyler* | 256 | 25.6 | 48.6 |
| | Liberal Democrats | Anna Davey | 177 | 17.7 | N/A |
| | Conservative | Alexander Walsh | 160 | 16.0 | 9.8 |
| | Reform UK | Fiona Stokes | 28 | 2.8 | N/A |
| Majority | 123 | 12.3 | 36.1 |
| Turnout | 1007 | 40.3 | |
| | Labour gain from Independent |
Backbury
Backbury | Party | Candidate | Votes | % | ±% |
| | Conservative | Graham Biggs | 394 | 35.2 | 5.7 |
| | Liberal Democrats | James Vidler | 385 | 34.4 | N/A |
| | Independent | John Hardwick* | 341 | 30.4 | 40.1 |
| Majority | 9 | 0.8 | 40.2 |
| Turnout | 1120 | 43.4 | |
| | Conservative gain from Independent |
Belmont Rural
Belmont Rural | Party | Candidate | Votes | % | ±% |
| | Liberal Democrats | Mark Dykes | 315 | 35.8 | N/A |
| | Conservative | Andy Cooper | 207 | 23.4 | 3.0 |
| | Independent | Alan Jones | 199 | 22.6 | N/A |
| | Independent | Rachael Percival | 93 | 10.6 | N/A |
| | Reform UK | Nigel Ely | 67 | 7.6 | N/A |
| Majority | 108 | 12.4 | 46.8 |
| Turnout | 883 | 31.1 | |
| | Liberal Democrats gain from It's Our County |
Birch
Birch | Party | Candidate | Votes | % | ±% |
| | Green | Toni Fagan* | 562 | 45.1 | 19.4 |
| | Conservative | Michael Agyeman | 533 | 42.8 | 7.3 |
| | Liberal Democrats | Alex Griffiths | 151 | 12.1 | N/A |
| Majority | 29 | 2.3 | 26.7 |
| Turnout | 1246 | 48.3 | |
| | Green hold |
Bircher
Bircher | Party | Candidate | Votes | % | ±% |
| | Conservative | Dan Hurcomb | 754 | 49.2 | 43.5 |
| | Independent | Sebastian Bowen* | 516 | 33.7 | 60.6 |
| | Green | Tessa Smith-Winnard | 137 | 8.9 | N/A |
| | Liberal Democrats | Angharad Pope | 126 | 8.2 | N/A |
| Majority | 258 | 15.5 | 73.1 |
| Turnout | 1535 | 47.3 | |
| | Conservative gain from Independent |
Bishops Frome and Cradley
Bishops Frome and Cradley | Party | Candidate | Votes | % | ±% |
| | Green | Ellie Chowns* | 801 | 68.9 | 9.7 |
| | Conservative | Mark Franklin | 316 | 27.2 | 5.8 |
| | Liberal Democrats | Robert Turner | 45 | 3.9 | N/A |
| Majority | 515 | 41.7 | 15.5 |
| Turnout | 1166 | 43.72 | |
| | Green hold |
Bobblestock
Bobblestock | Party | Candidate | Votes | % | ±% |
| | Liberal Democrats | Rob Owens | 244 | 29.4 | N/A |
| | Conservative | Clive Butler | 241 | 29.0 | 2.0 |
| | Independent | Tim Price* | 202 | 24.3 | 24.9 |
| | Labour | Anna Coda | 143 | 17.3 | N/A |
| Majority | 3 | 0.4 | -21.8 |
| Turnout | 836 | 31.93 | |
| | Liberal Democrats gain from Independent |
Bromyard Bringsty
Bromyard Bringsty | Party | Candidate | Votes | % | ±% |
| | Conservative | Peter Stoddart | 562 | 47.4 | 5.6 |
| | Green | Karen Rock | 370 | 31.2 | N/A |
| | Independent | Roger Page | 139 | 11.7 | 35.3 |
| | Liberal Democrats | Clare Hobbs | 115 | 9.7 | N/A |
| Majority | 198 | 16.2 | 10.2 |
| Turnout | 1191 | 27.35 | |
| | Conservative hold |
Bromyard West
Bromyard West | Party | Candidate | Votes | % | ±% |
| | Independent | Clare Davies* | 412 | 62.2 | N/A |
| | Conservative | Paul Harper | 116 | 17.5 | 22.4 |
| | Labour | Liam Holman | 86 | 13.0 | N/A |
| | Liberal Democrats | Clare West | 48 | 7.3 | N/A |
| Majority | 296 | 44.7 | 24.5 |
| Turnout | 664 | 27.35 | |
| | Independent gain from It's Our County |
Castle
Castle | Party | Candidate | Votes | % | ±% |
| | Conservative | Robert Highfield | 346 | 28.6 | 8.8 |
| | Independent | Alan Watkins | 345 | 28.5 | N/A |
| | Independent | Rob Rimmer | 316 | 26.1 | N/A |
| | Liberal Democrats | Scott Shaw | 203 | 16.8 | N/A |
| Majority | 1 | 0.1 | 25.1 |
| Turnout | 1117 | 43.34 | |
| | Conservative gain from Independent |
Central
Central | Party | Candidate | Votes | % | ±% |
| | Green | Catherine Gennard | 413 | 46.4 | 7.5 |
| | Liberal Democrats | Mal Williams | 268 | 30.0 | 8.0 |
| | Conservative | Michael Gray | 210 | 23.6 | 9.8 |
| Majority | 145 | 16.4 | 15.5 |
| Turnout | 900 | 35.3 | |
| | Green hold |
College
College | Party | Candidate | Votes | % | ±% |
| | Liberal Democrats | Ben Proctor | 230 | 29.5 | N/A |
| | Labour | Kath Hey* | 222 | 28.5 | N/A |
| | Conservative | Rachel Taylor | 209 | 26.8 | 9.9 |
| | Independent | Ian Skyrme | 73 | 9.4 | N/A |
| | Independent | Amanda Yilmaz | 46 | 5.8 | N/A |
| Majority | 8 | 1.0 | 8.5 |
| Turnout | 785 | 28.6 | |
| | Liberal Democrats gain from It's Our County |
Credenhill
Credenhill | Party | Candidate | Votes | % | ±% |
| | Independent | Bob Matthews* | 351 | 38.3 | 42.6 |
| | Conservative | Gareth Johnston | 308 | 33.6 | 14.5 |
| | Liberal Democrats | Paula Chambers | 137 | 15.0 | N/A |
| | Independent | Charlie Taylor | 120 | 13.1 | N/A |
| Majority | 43 | 4.7 | -57.1 |
| Turnout | 917 | 36.0 | |
| | Independent hold |
Dinedor Hill
Dinedor Hill | Party | Candidate | Votes | % | ±% |
| | Conservative | David Davies | 401 | 38.9 | 9.3 |
| | Liberal Democrats | Cat Hornsey | 370 | 35.9 | N/A |
| | It's Our County | David Summers* | 260 | 25.2 | 26.6 |
| Majority | 31 | 3.0 | 0.6 |
| Turnout | 1042 | 36.8 | |
| | Conservative gain from It's Our County |
Eign Hill
Eign Hill | Party | Candidate | Votes | % | ±% |
| | Independent | Elizabeth Foxton* | 440 | 38.4 | N/A |
| | Liberal Democrats | Sam Potts | 261 | 22.8 | 6.9 |
| | Labour | Steven Woolley | 238 | 20.8 | N/A |
| | Conservative | Anthony Thompson | 207 | 18.0 | 0.5 |
| Majority | 179 | 15.6 | 33.5 |
| Turnout | 1151 | 41.5 | |
| | Independent gain from It's Our County |
Golden Valley North
Golden Valley North | Party | Candidate | Votes | % | ±% |
| | Conservative | Philip Price | 584 | 46.6 | 9.9 |
| | Independent | Jennie Hewitt* | 492 | 39.2 | 13.5 |
| | Liberal Democrats | Brett Jenkins | 178 | 14.2 | N/A |
| Majority | 92 | 7.4 | 8.6 |
| Turnout | 1261 | 50.4 | |
| | Conservative gain from Independent |
Golden Valley South
Golden Valley South | Party | Candidate | Votes | % | ±% |
| | Independent | Peter Jinman* | 594 | 52.3 | 21.1 |
| | Conservative | Dave Greenow | 400 | 35.2 | 21.6 |
| | Liberal Democrats | Duncan Starling | 142 | 12.5 | N/A |
| Majority | 194 | 17.1 | 42.7 |
| Turnout | 1147 | 43.2 | |
| | Independent hold |
Greyfriars
Greyfriars | Party | Candidate | Votes | % | ±% |
| | Green | Diana Toynbee* | 398 | 41.3 | 11.6 |
| | Liberal Democrats | Matt Lane | 261 | 27.0 | 18.4 |
| | Conservative | Keith Farmer | 214 | 22.2 | 10,6 |
| | Independent | Neil Clark | 92 | 9.5 | N/A |
| Majority | 137 | 11.7 | 11.7 |
| Turnout | 1147 | 43.2 | |
| | Green hold |
Hagley
Hagley | Party | Candidate | Votes | % | ±% |
| | Independent | Ivan Powell | 407 | 33.0 | N/A |
| | Conservative | Josh Smith | 381 | 30.8 | 14.6 |
| | Liberal Democrats | Stephen Williams | 224 | 18.1 | N/A |
| | Independent | Paul Andrews* | 223 | 18.1 | 36.5 |
| Majority | 26 | 2.2 | 7.0 |
| Turnout | 1245 | 38.2 | |
| | Independent gain from Independent |
Hampton
Hampton | Party | Candidate | Votes | % | ±% |
| | Conservative | Bruce Baker | 545 | 44.2 | 0.8 |
| | Independent | John Harrington* | 420 | 34.1 | N/A |
| | Liberal Democrats | William Motley | 268 | 21.7 | N/A |
| Majority | 125 | 10.1 | 3.1 |
| Turnout | 1238 | 42.7 | |
| | Conservative gain from It's Our County |
Hinton & Hunderton
Hinton & Hunderton | Party | Candidate | Votes | % | ±% |
| | Liberal Democrats | Kevin Tillett* | 417 | 66.9 | 32.7 |
| | Conservative | Jeremy Chapman | 126 | 20.2 | 11.6 |
| | Independent | Amanda Martin | 80 | 12.8 | N/A |
| Majority | 191 | 46.7 | 38.7 |
| Turnout | 625 | 20.8 | |
| | Liberal Democrats hold |
Holmer
Holmer | Party | Candidate | Votes | % | ±% |
| | Conservative | Frank Cornthwaite | 366 | 33.4 | 3.1 |
| | Liberal Democrats | Paul Stevens | 315 | 28.7 | N/A |
| | Independent | Stephen Tannatt Nash | 205 | 18.7 | 11.9 |
| | Independent | John Phipps | 159 | 14.5 | 18.3 |
| | Independent | Mark Weaden | 51 | 4.7 | N/A |
| Majority | 41 | 4.7 | 1.0 |
| Turnout | 1104 | 32.8 | |
| | Conservative hold |
Hope End
Hope End | Party | Candidate | Votes | % | ±% |
| | Green | Helen Heathfield | 856 | 59.5 | N/A |
| | Conservative | Keith Pieri | 461 | 32.0 | 26.1 |
| | Liberal Democrats | Kim James | 122 | 8.5 | N/A |
| Majority | 395 | 27.5 | 15.9 |
| Turnout | 1447 | 48.8 | |
| | Green gain from Conservative | Swing | | |
Kerne Bridge
Kerne Bridge | Party | Candidate | Votes | % | ±% |
| | Conservative | Simeon Cole | 442 | 39.9 | 6.6 |
| | Liberal Democrats | Sarah Freer | 300 | 27.1 | N/A |
| | Independent | Katie Fowler | 280 | 25.3 | N/A |
| | Independent | Andrew Terry | 85 | 7.7 | N/A |
| Majority | 142 | 12.8 | 5.8 |
| Turnout | 1124 | 43.1 | |
| | Conservative gain from Independent |
Kings Acre
Kings Acre | Party | Candidate | Votes | % | ±% |
| | Conservative | Robert Williams | 270 | 32.2 | 2.7 |
| | Independent | Graham Andrews* | 240 | 28.6 | 41.5 |
| | Liberal Democrats | Debbie Hobbs | 236 | 28.1 | N/A |
| | Independent | James Murphy | 93 | 11.1 | N/A |
| Majority | 30 | 3.6 | 37.4 |
| Turnout | 847 | 32 | |
| | Conservative gain from Independent |
Kington
Kington | Party | Candidate | Votes | % | ±% |
| | Liberal Democrats | Terry James* | 487 | 48.5 | 32.7 |
| | Green | Helen Hamilton | 304 | 30.2 | N/A |
| | Independent | Fred Hawkins | 115 | 11.5 | N/A |
| | Conservative | Natasha Saunders | 98 | 9.8 | 9.0 |
| Majority | 83 | 18.3 | 44.1 |
| Turnout | 1005 | 39.1 | |
| | Liberal Democrats hold |
Ledbury North
Ledbury North | Party | Candidate | Votes | % | ±% |
| | It's Our County | Liz Harvey* | 424 | 44.0 | 10.5 |
| | Independent | Ewan Sinclair | 231 | 24.0 | N/A |
| | Liberal Democrats | Gem Murray | 172 | 17.9 | N/A |
| | Conservative | Cole Fellows | 136 | 14.1 | 31.4 |
| Majority | 293 | 20 | 11.0 |
| Turnout | 969 | 36.8 | |
| | It's Our County hold |
Ledbury South
Ledbury South | Party | Candidate | Votes | % | ±% |
| | Green | Stef Simmons | 424 | 38.6 | N/A |
| | Conservative | Helen l'Anson* | 352 | 32.0 | 6.6 |
| | Liberal Democrats | Matthew Eakin | 241 | 21.9 | 11.3 |
| | Labour | Will Hopkins | 82 | 7.5 | 12.8 |
| Majority | 72 | 6.6 | 1.2 |
| Turnout | 1101 | 38.3 | |
| | Green gain from Conservative |
Ledbury West
Ledbury West | Party | Candidate | Votes | % | ±% |
| | Green | Justine Peberdy | 431 | 46.1 | N/A |
| | Conservative | Rachel F. Finch | 218 | 23.3 | 0.3 |
| | Liberal Democrats | Phillip Howells* | 194 | 20.8 | 8.7 |
| | Labour | Jonathan Browning | 91 | 9.8 | N/A |
| Majority | 213 | 15.2 | 29.4 |
| Turnout | 936 | 34.5 | |
| | Green gain from Liberal Democrats |
Leominster East
Leominster East | Party | Candidate | Votes | % | ±% |
| | Green | Jenny Bartlett* | 452 | 50.0 | 22.3 |
| | Conservative | Simon Donegan | 315 | 34.8 | 7.1 |
| | Liberal Democrats | Marcus Murray | 137 | 15.2 | N/A |
| Majority | 137 | 15.2 | 29.4 |
| Turnout | 908 | 30.5 | |
| | Green hold |
Leominster North and Rural
Leominster North and Rural | Party | Candidate | Votes | % | ±% |
| | Conservative | John Stone* | 524 | 49.0 | 14.7 |
| | Green | Bryony John | 456 | 42.7 | 6.4 |
| | Liberal Democrats | Mary Springer | 89 | 8.3 | N/A |
| Majority | 68 | 6.3 | 21.1 |
| Turnout | 1075 | 34.8 | |
| | Conservative hold |
Leominster South
Leominster South | Party | Candidate | Votes | % | ±% |
| | Green | Mark Woodall | 379 | 45.0 | 27.7 |
| | Conservative | Angeline Logan | 262 | 31.1 | 3.8 |
| | Liberal Democrats | Lorraine Chatwin | 104 | 12.3 | N/A |
| | Labour Co-op | Nick Comley | 98 | 11.6 | N/A |
| Majority | 117 | 13.9 | 31.5 |
| Turnout | 851 | 32.0 | |
| | Green hold |
Leominster West
Leominster West | Party | Candidate | Votes | % | ±% |
| | Conservative | Allan Williams | 371 | 49.7 | 35.0 |
| | Green | Jill Hanna | 267 | 35.7 | 36.9 |
| | Liberal Democrats | Clive Thomas | 109 | 14.6 | 1.9 |
| Majority | 104 | 14.0 | 43.9 |
| Turnout | 754 | 34.9 | |
| | Conservative gain from Green |
Llangarron
Llangarron | Party | Candidate | Votes | % | ±% |
| | Conservative | Elissa Swinglehurst* | 652 | 54.2 | |
| | Liberal Democrats | Michelle Stetchfield | 551 | 45.8 | N/A |
| Majority | 101 | 8.4 | |
| Turnout | 1217 | 56.4 | |
| | Conservative hold |
Mortimer
Mortimer | Party | Candidate | Votes | % | ±% |
| | Conservative | Carole Gandy* | 562 | 54.8 | 1.2 |
| | Liberal Democrats | Susan Roberts | 246 | 24.0 | 2.2 |
| | Green | Callum Coomber | 217 | 21.2 | N/A |
| Majority | 316 | 30.8 | 1.8 |
| Turnout | 1036 | 38.8 | |
| | Conservative hold |
Newton Farm
Newton Farm | Party | Candidate | Votes | % | ±% |
| | Liberal Democrats | Jacqui Carwardine | 277 | 44.7 | 18.2 |
| | Labour | Joe Emmett | 201 | 32.4 | 14.2 |
| | Conservative | John Jones | 142 | 22.9 | 15.1 |
| Majority | 76 | 12.3 | 7.9 |
| Turnout | 19.9 | 622 | |
| | Liberal Democrats gain from Independent |
Old Gore
Old Gore | Party | Candidate | Votes | % | ±% |
| | Conservative | Barry Durkin* | 524 | 44.4 | 13.9 |
| | Independent | Gemma Davies | 372 | 31.5 | N/A |
| | Liberal Democrats | Linden Delves | 285 | 24.1 | N/A |
| Majority | 152 | 13.2 | 3.4 |
| Turnout | 1188 | 47.2 | |
| | Conservative hold |
Penyard
Penyard | Party | Candidate | Votes | % | ±% |
| | Conservative | Harry Bramer | 738 | 57.4 | 13.8 |
| | Liberal Democrats | John Winder | 547 | 42.6 | N/A |
| Majority | 191 | 14.8 | 10.7 |
| Turnout | 1297 | 41.9 | |
| | Conservative gain from Independent |
Queenswood
Queenswood | Party | Candidate | Votes | % | ±% |
| | Independent | Pauline Crockett* | 346 | 31.2 | 49.6 |
| | Conservative | Nicholas Entwisle | 290 | 26.1 | 6.9 |
| | Independent | Colin Williams | 277 | 25.0 | N/A |
| | Liberal Democrats | Tim Fry | 196 | 17.7 | N/A |
| Majority | 56 | 5.1 | 56.5 |
| Turnout | 1113 | 40.1 | |
| | Independent hold |
Red Hill
Red Hill | Party | Candidate | Votes | % | ±% |
| | Liberal Democrats | Dan Powell | 539 | 64.1 | 27.4 |
| | Conservative | Steve Williams | 302 | 35.9 | 3.9 |
| Majority | 247 | 28.2 | 8.0 |
| Turnout | 844 | 28.8 | |
| | Liberal Democrats gain from Conservative |
Ross East
Ross East | Party | Candidate | Votes | % | ±% |
| | Liberal Democrats | Ed O'Driscoll | 417 | 36.5 | 9.5 |
| | Conservative | Becky Walsh | 293 | 25.6 | 1.5 |
| | Independent | Milly Boylan | 258 | 22.6 | N/A |
| | Labour | Nick Richmond | 152 | 13.3 | 5.4 |
| | Independent | Adam Fielding | 24 | 2.1 | N/A |
| Majority | 124 | 10.9 | 8.0 |
| Turnout | 1148 | 38.7 | |
| | Liberal Democrats hold |
Ross North
Ross North | Party | Candidate | Votes | % | ±% |
| | Liberal Democrats | Chris Bartrum* | 350 | 37.7 | 37.4 |
| | Independent | Daniel Lister | 313 | 33.8 | N/A |
| | Conservative | Valerie Coker | 153 | 16.5 | 2.2 |
| | Labour | Melvin Hodges | 111 | 12.0 | 5.2 |
| Majority | 37 | 3.9 | 52.5 |
| Turnout | 933 | 30.8 | |
| | Liberal Democrats hold |
Ross West
Ross West | Party | Candidate | Votes | % | ±% |
| | Liberal Democrats | Louis Stark* | 423 | 43.3 | 4.0 |
| | Conservative | Nigel Gibbs | 240 | 24.6 | 6.5 |
| | Independent | Rob Taylor | 207 | 21.2 | 0.5 |
| | Labour | Edward Philpott | 106 | 10.9 | N/A |
| Majority | 183 | 18.7 | 2.6 |
| Turnout | 982 | 36.4 | |
| | Liberal Democrats hold |
Saxon Gate
Saxon Gate | Party | Candidate | Votes | % | ±% |
| | Liberal Democrats | Aubrey Oliver | 363 | 54.1 | 25.9 |
| | Conservative | William Norman | 135 | 20.1 | 1.3 |
| | Independent | John Jones | 123 | 18.3 | N/A |
| | Reform UK | Daniel Coughlin | 50 | 7.5 | N/A |
| Majority | 228 | 34.0 | 9.2 |
| Turnout | 675 | 23.4 | |
| | Liberal Democrats gain from Independent |
Stoney Street
Stoney Street | Party | Candidate | Votes | % | ±% |
| | Independent | David Hitchiner | 406 | 35.3 | 20.2 |
| | Conservative | Phillip Cutter | 374 | 32.5 | 6.3 |
| | Liberal Democrats | David Howerski | 371 | 32.2 | 13.9 |
| Majority | 32 | 2.8 | 26.5 |
| Turnout | 1155 | 40.0 | |
| | Independent hold |
Sutton Walls
Sutton Walls | Party | Candidate | Votes | % | ±% |
| | Conservative | Peter Hamblin | 483 | 45.8 | 4.9 |
| | Green | Taylor Whitchurch | 197 | 18.7 | N/A |
| | Liberal Democrats | Scott Richardson | 192 | 18.2 | N/A |
| | Independent | Steve Williams | 183 | 17.3 | 32.0 |
| Majority | 186 | 27.1 | 25.7 |
| Turnout | 1060 | 40.3 | |
| | Conservative hold |
Three Crosses
Three Crosses | Party | Candidate | Votes | % | ±% |
| | Conservative | Jonathan Lester* | 763 | 55.6 | 6.0 |
| | Green | Rebecca Tully | 461 | 33.7 | 4.7 |
| | Liberal Democrats | Duncan Cooper | 142 | 10.4 | N/A |
| Majority | 302 | 21.9 | 1.3 |
| Turnout | 1372 | 47.0 | |
| | Conservative hold |
Tupsley
Tupsley | Party | Candidate | Votes | % | ±% |
| | Independent | Jim Kenyon* | 556 | 48.0 | 31.9 |
| | Independent | Liz Board | 335 | 28.9 | N/A |
| | Liberal Democrats | Hugh Brooks | 142 | 12.3 | N/A |
| | Conservative | Patrick Pytka | 125 | 10.8 | 9.3 |
| Majority | 221 | 19.1 | 31.7 |
| Turnout | 1159 | 46.7 | |
| | Independent hold |
Weobley
Weobley | Party | Candidate | Votes | % | ±% |
| | Conservative | Nicholas Mason | 450 | 38.9 | 6.0 |
| | Independent | Mike Jones* | 404 | 34.9 | 8.8 |
| | Liberal Democrats | Barry Ashton | 304 | 26.3 | N/A |
| Majority | 46 | 4.0 | 6.8 |
| Turnout | 1171 | 39.3 | |
| | Conservative gain from Independent |
Whitecross
Whitecross | Party | Candidate | Votes | % | ±% |
| | It's Our County | Dave Boulter | 212 | 29.8 | 17.9 |
| | Liberal Democrats | Emma Mayes | 185 | 26.0 | 8.4 |
| | Conservative | Marsha Barnsley | 143 | 20.1 | 5.6 |
| | Labour | Billie Kupeli | 122 | 17.1 | N/A |
| | Reform UK | Richard Smith | 50 | 7.0 | N/A |
| Majority | 27 | 3.8 | 23.8 |
| Turnout | 714 | 27.5 | |
| | It's Our County hold |
Widemarsh
Widemarsh | Party | Candidate | Votes | % | ±% |
| | Liberal Democrats | Polly Andrews* | 233 | 38.9 | 0.6 |
| | Labour | Neil Barrington | 204 | 34.1 | N/A |
| | Conservative | Kathy Handby | 113 | 18.9 | 8.0 |
| | Reform UK | Mick Gunner | 49 | 8.2 | N/A |
| Majority | 19 | 4.8 | 4.9 |
| Turnout | 604 | 25.4 | |
| | Liberal Democrats hold |
Wormside
Wormside | Party | Candidate | Votes | % | ±% |
| | Conservative | Richard Thomas | 481 | 41.5 | 9.6 |
| | Independent | Simon Davies | 362 | 31.3 | N/A |
| | Liberal Democrats | Edward Hickie | 242 | 20.9 | N/A |
| | Reform UK | Robert Cribb | 73 | 6.3 | N/A |
| Majority | 119 | 10.2 | 1.6 |
| Turnout | 1168 | 39.0 | |
| | Conservative hold |
Changes 2023–2027
- Simeon Cole, elected as a Conservative, joined the Liberal Democrats in February 2024.[7]
References
- ^ Of the 25 councillors prior to the election who did not belong to a registered political party, 18 formed the "Independents for Herefordshire" group led by David Hitchiner, 6 formed the "True Independents" group led by Bob Matthews, and 1 (Jim Kenyon) did not belong to any group.
- ^ There were six councillors prior to the election who had been elected as It's Our County candidates, but all sat in the "Independents for Herefordshire" group. Of those six, three stood again for It's Our County in 2023 (Dave Boulter, Liz Harvey and David Summers), two stood as independent candidates (Elizabeth Foxton and John Harrington), and one did not stand for re-election (Tracy Bowes).
- ^ "Local Government Elections". Herefordshire Council. Retrieved 27 April 2023.
- ^ McEwan, Gavin (3 May 2023). "Herefordshire election: what is the current state of the parties?". Ledbury Reporter. Retrieved 22 May 2023.
- ^ Pearson, James; Jones, Megan (19 May 2023). "Minority council elects Conservative leader". BBC News. Retrieved 20 May 2023.
- ^ "District elections and candidates". Herefordshire Council. Retrieved 27 April 2023.
- ^ McEwan, Gavin (12 May 2023). "Herefordshire elections: the full results". Hereford Times. Retrieved 22 May 2023.
- ^ "District (ward) election results". Herefordshire Council. Retrieved 22 May 2023.
- ^ Boothroyd, David (16 February 2024). "Will you ever win?". Local Councils. Thorncliffe. Retrieved 11 May 2024.


 8
8  10
10 
 Council elections in Herefordshire


