1980 United States presidential election in Montana
|
| ← 1976 | November 4, 1980 (1980-11-04) | 1984 → |
|
| |  |  |  | | Nominee | Ronald Reagan | Jimmy Carter | John B. Anderson | | Party | Republican | Democratic | Independent | | Home state | California | Georgia | Illinois | | Running mate | George H. W. Bush | Walter Mondale | Patrick Lucey | | Electoral vote | 4 | 0 | 0 | | Popular vote | 206,814 | 118,032 | 29,281 | | Percentage | 56.82% | 32.43% | 8.05% | |
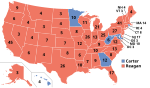
 County Results | Reagan 40–50% 50–60% 60–70% 70–80% | Carter 50–60% | |
President before election
Jimmy Carter
Democratic | Elected President
Ronald Reagan
Republican | |
| Elections in Montana |
|---|
 |
| |
| |
| |
| |
| |
| Mayoral elections |
|---|
- 2001
- 2005
- 2009
- 2013
- 2017
- 2021
- 2025
|
|
| Mayoral elections |
|---|
- 2001
- 2005
- 2009
- 2013
- 2017
- 2021
- 2025
|
|
| Mayoral elections |
|---|
- 2001
- 2005
- 2009
- 2013
- 2017
- 2021
- 2025
|
|
|
The 1980 United States presidential election in Montana took place on November 4, 1980, and was part of the 1980 United States presidential election. Voters chose four representatives, or electors to the Electoral College, who voted for president and vice president.
Montana overwhelmingly voted for the Republican nominee, Governor Ronald Reagan, over the Democratic nominee, President Jimmy Carter. Reagan won Montana by a landslide margin of 24.39%. As of the 2020 presidential election[update], this is the last election in which Big Horn County voted for a Republican presidential candidate. [1]
Results
| 1980 United States presidential election in Montana[2] |
| Party | Candidate | Votes | Percentage | Electoral votes |
| | Republican | Ronald Reagan | 206,814 | 56.82% | 4 |
| | Democratic | Jimmy Carter (incumbent) | 118,032 | 32.43% | 0 |
| | Independent | John B. Anderson | 29,281 | 8.05% | 0 |
| | Libertarian | Ed Clark | 9,825 | 2.70% | 0 |
| Totals | 363,952 | 100.00% | 4 |
Results by county
| County | Ronald Reagan
Republican | Jimmy Carter
Democratic | John B. Anderson
Independent | Ed Clark
Libertarian | Margin | Total votes cast |
| # | % | # | % | # | % | # | % | # | % |
| Beaverhead | 2,955 | 72.02% | 842 | 20.52% | 205 | 5.00% | 101 | 2.46% | 2,113 | 51.50% | 4,103 |
| Big Horn | 1,730 | 46.32% | 1,644 | 44.02% | 308 | 8.25% | 53 | 1.42% | 86 | 2.30% | 3,735 |
| Blaine | 1,686 | 56.29% | 1,107 | 36.96% | 163 | 5.44% | 39 | 1.30% | 579 | 19.33% | 2,995 |
| Broadwater | 1,052 | 67.26% | 401 | 25.64% | 69 | 4.41% | 42 | 2.69% | 651 | 41.62% | 1,564 |
| Carbon | 2,471 | 56.64% | 1,468 | 33.65% | 331 | 7.59% | 93 | 2.13% | 1,003 | 22.99% | 4,363 |
| Carter | 766 | 72.40% | 237 | 22.40% | 37 | 3.50% | 18 | 1.70% | 529 | 50.00% | 1,058 |
| Cascade | 17,664 | 54.80% | 11,105 | 34.45% | 2,655 | 8.24% | 810 | 2.51% | 6,559 | 20.35% | 32,234 |
| Chouteau | 2,448 | 68.32% | 853 | 23.81% | 216 | 6.03% | 66 | 1.84% | 1,595 | 44.51% | 3,583 |
| Custer | 3,533 | 60.75% | 1,822 | 31.33% | 369 | 6.34% | 92 | 1.58% | 1,711 | 29.42% | 5,816 |
| Daniels | 1,086 | 65.19% | 483 | 28.99% | 77 | 4.62% | 20 | 1.20% | 603 | 36.20% | 1,666 |
| Dawson | 3,045 | 59.50% | 1,543 | 30.15% | 424 | 8.28% | 106 | 2.07% | 1,502 | 29.35% | 5,118 |
| Deer Lodge | 1,905 | 33.79% | 3,077 | 54.58% | 474 | 8.41% | 182 | 3.23% | -1,172 | -20.79% | 5,638 |
| Fallon | 1,286 | 66.98% | 512 | 26.67% | 94 | 4.90% | 28 | 1.46% | 774 | 40.31% | 1,920 |
| Fergus | 4,455 | 65.02% | 1,840 | 26.85% | 388 | 5.66% | 169 | 2.47% | 2,615 | 38.17% | 6,852 |
| Flathead | 15,102 | 63.54% | 6,349 | 26.71% | 1,621 | 6.82% | 695 | 2.92% | 8,753 | 36.83% | 23,767 |
| Gallatin | 12,738 | 58.63% | 5,747 | 26.45% | 2,432 | 11.19% | 809 | 3.72% | 6,991 | 32.18% | 21,726 |
| Garfield | 760 | 78.03% | 169 | 17.35% | 29 | 2.98% | 16 | 1.64% | 591 | 60.68% | 974 |
| Glacier | 2,283 | 55.78% | 1,394 | 34.06% | 297 | 7.26% | 119 | 2.91% | 889 | 21.72% | 4,093 |
| Golden Valley | 362 | 65.11% | 155 | 27.88% | 28 | 5.04% | 11 | 1.98% | 207 | 37.23% | 556 |
| Granite | 811 | 59.15% | 439 | 32.02% | 76 | 5.54% | 45 | 3.28% | 372 | 27.13% | 1,371 |
| Hill | 4,448 | 54.99% | 2,875 | 35.54% | 604 | 7.47% | 162 | 2.00% | 1,573 | 19.45% | 8,089 |
| Jefferson | 1,841 | 57.12% | 1,055 | 32.73% | 216 | 6.70% | 111 | 3.44% | 786 | 24.39% | 3,223 |
| Judith Basin | 1,030 | 63.31% | 480 | 29.50% | 93 | 5.72% | 24 | 1.48% | 550 | 33.81% | 1,627 |
| Lake | 5,083 | 59.58% | 2,615 | 30.65% | 573 | 6.72% | 261 | 3.06% | 2,468 | 28.93% | 8,532 |
| Lewis and Clark | 12,128 | 57.18% | 6,815 | 32.13% | 1,793 | 8.45% | 476 | 2.24% | 5,313 | 25.05% | 21,212 |
| Liberty | 872 | 69.43% | 283 | 22.53% | 71 | 5.65% | 30 | 2.39% | 589 | 46.90% | 1,256 |
| Lincoln | 4,202 | 57.19% | 2,422 | 32.96% | 485 | 6.60% | 239 | 3.25% | 1,780 | 24.23% | 7,348 |
| McCone | 1,000 | 67.98% | 349 | 23.73% | 86 | 5.85% | 36 | 2.45% | 651 | 44.25% | 1,471 |
| Madison | 2,220 | 70.59% | 676 | 21.49% | 174 | 5.53% | 75 | 2.38% | 1,544 | 49.10% | 3,145 |
| Meagher | 689 | 69.60% | 247 | 24.95% | 41 | 4.14% | 13 | 1.31% | 442 | 44.65% | 990 |
| Mineral | 800 | 48.28% | 660 | 39.83% | 138 | 8.33% | 59 | 3.56% | 140 | 8.45% | 1,657 |
| Missoula | 16,161 | 46.72% | 13,115 | 37.91% | 3,847 | 11.12% | 1,471 | 4.25% | 3,046 | 8.81% | 34,594 |
| Musselshell | 1,279 | 58.03% | 784 | 35.57% | 106 | 4.81% | 35 | 1.59% | 495 | 22.46% | 2,204 |
| Park | 3,929 | 63.42% | 1,663 | 26.84% | 459 | 7.41% | 144 | 2.32% | 2,266 | 36.58% | 6,195 |
| Petroleum | 225 | 65.98% | 90 | 26.39% | 15 | 4.40% | 11 | 3.23% | 135 | 39.59% | 341 |
| Phillips | 1,723 | 64.95% | 745 | 28.08% | 146 | 5.50% | 39 | 1.47% | 978 | 36.87% | 2,653 |
| Pondera | 2,270 | 66.14% | 897 | 26.14% | 207 | 6.03% | 58 | 1.69% | 1,373 | 40.00% | 3,432 |
| Powder River | 985 | 68.26% | 336 | 23.28% | 94 | 6.51% | 28 | 1.94% | 649 | 44.98% | 1,443 |
| Powell | 1,770 | 59.14% | 883 | 29.50% | 198 | 6.62% | 142 | 4.74% | 887 | 29.64% | 2,993 |
| Prairie | 580 | 62.57% | 283 | 30.53% | 57 | 6.15% | 7 | 0.76% | 297 | 32.04% | 927 |
| Ravalli | 7,268 | 63.73% | 3,063 | 26.86% | 743 | 6.52% | 330 | 2.89% | 4,205 | 36.87% | 11,404 |
| Richland | 3,348 | 66.45% | 1,252 | 24.85% | 343 | 6.81% | 95 | 1.89% | 2,096 | 41.60% | 5,038 |
| Roosevelt | 2,298 | 55.24% | 1,504 | 36.15% | 304 | 7.31% | 54 | 1.30% | 794 | 19.09% | 4,160 |
| Rosebud | 1,875 | 54.46% | 1,167 | 33.89% | 265 | 7.70% | 136 | 3.95% | 708 | 20.57% | 3,443 |
| Sanders | 2,194 | 54.86% | 1,395 | 34.88% | 291 | 7.28% | 119 | 2.98% | 799 | 19.98% | 3,999 |
| Sheridan | 1,658 | 56.94% | 955 | 32.80% | 247 | 8.48% | 52 | 1.79% | 703 | 24.14% | 2,912 |
| Silver Bow | 7,301 | 37.68% | 9,721 | 50.17% | 1,752 | 9.04% | 603 | 3.11% | -2,420 | -12.49% | 19,377 |
| Stillwater | 1,828 | 61.26% | 919 | 30.80% | 181 | 6.07% | 56 | 1.88% | 909 | 30.46% | 2,984 |
| Sweet Grass | 1,169 | 67.22% | 440 | 25.30% | 98 | 5.64% | 32 | 1.84% | 729 | 41.92% | 1,739 |
| Teton | 2,415 | 67.76% | 902 | 25.31% | 186 | 5.22% | 61 | 1.71% | 1,513 | 42.45% | 3,564 |
| Toole | 2,000 | 70.18% | 634 | 22.25% | 154 | 5.40% | 62 | 2.18% | 1,366 | 47.93% | 2,850 |
| Treasure | 321 | 57.94% | 181 | 32.67% | 34 | 6.14% | 18 | 3.25% | 140 | 25.27% | 554 |
| Valley | 3,242 | 62.47% | 1,567 | 30.19% | 264 | 5.09% | 117 | 2.25% | 1,675 | 32.28% | 5,190 |
| Wheatland | 742 | 60.33% | 381 | 30.98% | 88 | 7.15% | 19 | 1.54% | 361 | 29.35% | 1,230 |
| Wibaux | 450 | 61.56% | 219 | 29.96% | 45 | 6.16% | 17 | 2.33% | 231 | 31.60% | 731 |
| Yellowstone | 27,332 | 56.57% | 15,272 | 31.61% | 4,590 | 9.50% | 1,119 | 2.32% | 12,060 | 24.96% | 48,313 |
| Totals | 206,814 | 56.82% | 118,032 | 32.43% | 29,281 | 8.05% | 9,825 | 2.70% | 88,782 | 24.39% | 363,952 |
Counties that flipped from Democratic to Republican
See also
References
- ^ Sullivan, Robert David; ‘How the Red and Blue Map Evolved Over the Past Century’; America Magazine in The National Catholic Review; June 29, 2016
- ^ David Leip. "1980 Presidential General Election Results – Montana". Dave Leip’s Atlas of U.S. Presidential Elections. Retrieved March 18, 2008.
|
|---|
| President | |
|---|
U.S.
Senate | |
|---|
U.S.
House | |
|---|
| Governors | |
|---|
State
legislatures | |
|---|
| Mayors | - Baton Rouge, LA
- San Diego, CA
- San Juan, PR
|
|---|